

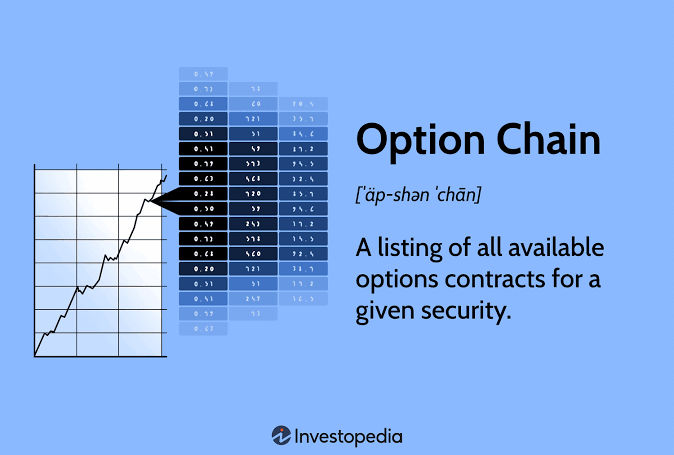
An option chain can help traders assess market expectations, identify important price levels and understand the balance between call and put contracts. For SBI options, reading the option chain before entering a position can provide useful information about open interest, volume, implied volatility and option premiums. However, an option chain should be used alongside price action, technical analysis and risk management rather than as a standalone signal.
What is an SBI Option Chain?
An SBI option chain is a structured list of available call and put option contracts for State Bank of India. It displays different strike prices and provides information such as open interest, changes in open interest, trading volume, implied volatility, last traded price and bid-ask prices.
The option chain can help traders understand where market participants are building positions and which strike prices may have significant activity.
Before analysing the chain, check:
- The underlying SBI stock price.
- The option expiry date.
- Available strike prices around the current market price.
- Call and put premiums.
- Open interest and changes in open interest.
- Trading volume and implied volatility.
How to Read an SBI Option Chain
Reading an option chain becomes easier when you examine its key components systematically.
1. Identify The Underlying Price
Start by checking the current SBI Share Price before analysing the option chain. This helps you identify the at-the-money (ATM) strike, which is generally the strike price closest to the current stock price. The underlying price provides the reference point for comparing nearby call and put strikes.
For example, if SBI is trading near ₹1,000, the ₹1,000 strike may be considered ATM. You can then examine strikes above and below this level to understand where traders are building positions.
2. Understand Call And Put Options
The option chain is generally divided into two sections:
- Call options (CE): These give the buyer the right, but not the obligation, to buy the underlying asset at the specified strike price.
- Put options (PE): These give the buyer the right, but not the obligation, to sell the underlying asset at the specified strike price.
The strike prices are usually displayed in the centre, with call-related data on one side and put-related data on the other.
3. Analyse Open Interest
Open interest (OI) represents the number of outstanding option contracts that have not yet been closed or settled.
Higher OI at a particular strike can indicate significant market participation at that level. Traders often observe:
- High call OI as a potential resistance area.
- High put OI as a potential support area.
- Rising call OI as possible call writing or fresh positioning.
- Rising put OI as possible put writing or fresh positioning.
However, OI alone does not confirm whether traders are buying or writing options. It should therefore be assessed with changes in premium, volume and price movement.
4. Check Change In Open Interest
Change in OI shows whether contracts are being added or removed during the trading session.
A commonly used interpretation is:
- Price rises + OI rises: Possible long build-up.
- Price falls + OI rises: Possible short build-up.
- Price rises + OI falls: Possible short covering.
- Price falls + OI falls: Possible long unwinding.
These combinations provide clues about market positioning, but they should not be treated as guaranteed signals.
5. Look At Volume
Volume indicates how many contracts have been traded during a period. A strike with substantial volume can attract greater attention from traders.
Compare volume with OI rather than examining either metric independently. High volume with increasing OI may suggest fresh positions are being created, while high volume with declining OI may indicate positions are being closed.
6. Observe Implied Volatility
Implied volatility (IV) reflects the market’s expectations regarding potential price movement. Higher IV generally results in higher option premiums, while lower IV can reduce premiums, all else being equal.
Before reading SBI option chain, compare IV across nearby strikes and different expiry dates. A sharp increase in IV may also indicate that the market expects greater uncertainty or volatility.
Conclusion
Reading an SBI option chain can help traders understand positioning, potential support and resistance levels, volatility and market activity before taking an options position. The most effective approach is to combine OI, change in OI, volume, IV and option premiums with price action and disciplined risk management. An option chain provides market information, not certainty, so every trade should have a clearly defined risk limit. Using a structured approach can make option-chain analysis more consistent, including when trading through platforms such as 5 paisa.